
1. The Alert That Was There
In April 2023, a financial services firm experienced a ransomware deployment that encrypted 40% of its production environment before containment. The incident response investigation surfaced an uncomfortable finding: the SIEM had generated an alert for the initial lateral movement 31 hours before the ransomware deployed.
The alert had a medium severity rating. It was one of 14,000 alerts generated that day. The three analysts on shift had reviewed approximately 800 of them. The lateral movement alert was in the unreviewed queue when the ransomware executed.
The firm’s response was to hire two additional analysts and purchase a new endpoint detection tool. Alert volume increased by 3,000 per day. The underlying problem did not change.
The threat was not undetected. It was detected and ignored, not because the analysts were negligent, but because the architecture produced a signal-to-noise ratio so poor that a legitimate high-risk alert was indistinguishable from the thousands of low-fidelity alerts surrounding it. That is not an analyst problem. It is an architecture problem.
2. What Alert Fatigue Actually Is and What It Is Not
Alert fatigue is the systematic degradation of analyst decision quality that occurs when alert volume consistently exceeds the capacity for meaningful investigation. It is a predictable outcome of a detection architecture that optimises for coverage breadth at the expense of signal fidelity.
Understanding what alert fatigue is not as important as understanding what it is:
- It is not a staffing problem: Adding analysts to a high-volume, low-fidelity alert environment does not reduce alert fatigue, it distributes it. Each additional analyst processes more alerts from the same broken detection rules. The per-analyst volume drops; the fidelity does not improve; the detection outcomes do not change materially.
- It is not a tool problem: Alert fatigue is not caused by having the wrong security tools. It is caused by having tools that generate alerts without those alerts being correlated, contextualised, and scored before they reach an analyst. Adding more tools to a non-fidelity-scored alert environment adds volume, not capability.
- It is not inevitable: Alert fatigue is presented in most security operations discussions as an inherent feature of the threat landscape, a problem to be managed rather than solved. It is neither inherent nor unsolvable. It is the predictable output of a detection architecture that has not been designed for fidelity, and it is addressable through architectural change.
The instinct to respond to alert fatigue with more analysts and more tools is understandable. It is also precisely backwards. Every additional analyst hired into a high-volume, low-fidelity environment accelerates the fatigue cycle. Every additional tool purchased without fidelity architecture compounds the volume problem it was intended to solve.
3. Why More Tools Make the Problem Worse, Not Better
The average enterprise SOC operates between 10 and 15 distinct security tools. Each tool was purchased to address a specific threat category or coverage gap. Each generates its own alert stream. None of them, in most enterprise environments, are integrated into a unified correlation and fidelity-scoring layer before their alerts reach an analyst.
The result is a compounding problem. Each tool added to address a detection gap adds between 500 and 2,000 alerts per day to the analyst queue. The coverage gap is addressed. The signal-to-noise ratio degrades. The net effect on detection quality is negative not because the tool is not detecting threats, but because the alerts it generates cannot be acted on in the volume in which they arrive.
| Alert volume regime | What it produces | Actual security outcome |
|---|---|---|
| Low volume, high fidelity | Every alert reviewed. | High threats detected and contained. Analyst judgment applied where it matters. |
| Moderate volume, mixed fidelity | Most alerts reviewed | Moderate: Coverage adequate for known patterns. Novel threats begin to slip through. |
| High volume, low fidelity | Alert queue exceeds | Degraded: Analysts review what they can. Threats hidden in volume pass undetected. |
| Extreme volume, no fidelity scoring | Analysts stop investigating. | Near zero: The SOC is generating activity reports, not security outcomes. |
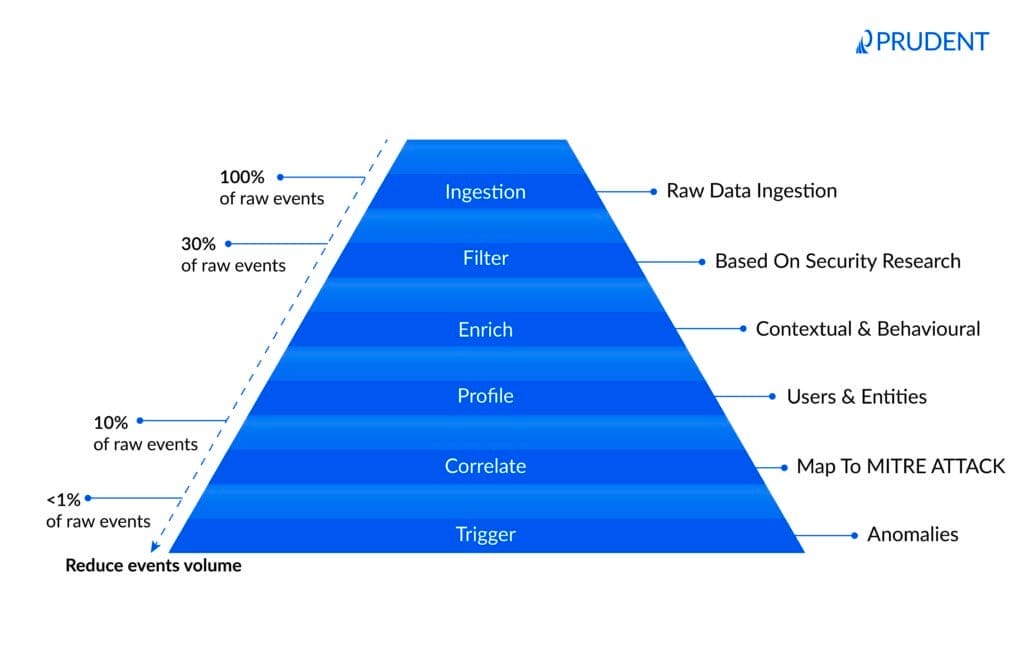
4. From Alert Noise to Actionable Signal
This model illustrates how a fidelity-optimised SOC reduces overwhelming raw event volume into a small set of high-confidence, actionable alerts. Through filtering, enrichment, profiling, and correlation, security operations shift from reactive alert processing to intelligent threat detection. By adding context and behavioural analysis before alerts reach analysts, organisations improve detection speed, reduce false positives, and focus investigations on the threats that truly matter.
5. The Root Causes That Headcount Cannot Fix
Alert fatigue has five consistent root causes in enterprise SOC environments. Each of them is an architectural problem. None of them are resolved by hiring more analysts, a fact that becomes apparent when organisations track detection outcomes after headcount increases and find that dwell time, incident frequency, and analyst attrition remain unchanged.
| Root cause | How it manifests | Why adding analysts does not fix it |
|---|---|---|
| Misconfigured detection rules | Rules written broadly to maximise coverage, every deviation triggers an alert regardless of risk context | More analysts process more alerts from the same broken rules. Volume drops per analyst; fidelity does not improve. |
| Tool proliferation without integration | Each security tool generates its own alert stream. No correlation. Same event produces 4-6 alerts across different platforms. | Analysts triage the same underlying event multiple times from different tool consoles. Headcount multiplies the duplication. |
| No risk-based prioritisation | All alerts presented at equal weight. A misconfigured endpoint alert ranks alongside a credential compromise alert. | Analysts develop their own informal prioritisation heuristics, inconsistently applied and invisible to management. |
| Context-free alerting | Alert contains an event but no surrounding context, no asset criticality, no user role, no prior behaviour baseline. | Analysts spend most of their time assembling context from other systems rather than making decisions. More analysts assemble more context; detection speed does not improve. |
| No feedback loop on false positives | False positives are closed without being recorded or fed back into rule tuning. Same rules fire the same false positives indefinitely. | False positive volume is permanent. More analysts absorb more false positives. The problem does not decay. |
The common thread across all five root causes is that they are self-perpetuating in the absence of architectural intervention. Misconfigured rules continue firing. Unintegrated tools continue duplicating. False positives continue accumulating. The analyst team absorbs the volume, degrades in quality, loses its experienced members, and is replaced, at which point the cycle restarts with a less experienced team facing the same structural problem.
6. Five Scenarios: The Same Threat, Two Detection Outcomes
Each scenario below maps an identical threat through a high-volume, low-fidelity SOC and a fidelity-optimised SOC. The threat is the same. The detection tooling is the same. The outcome is determined entirely by the architecture between the tools and the analysts.
| Scenario | In a high-volume, low-fidelity SOC | In a fidelity-optimised SOC |
|---|---|---|
| Ransomware pre-positioning at 11pm on a Friday | Alert generated. Queue of 4,000 unreviewed alerts. Reviewed Monday morning. Encryption complete by Saturday. | High-fidelity alert surfaces immediately. Correlated with asset criticality and time-of-day anomaly. On-call analyst responds within 8 minutes. Contained before staging completes. |
| Credential compromise buried in 6,000 Tuesday alerts | Alert is one of 6,000 generated that day. Analyst applies severity heuristic. Medium severity, reviewed in batch. Context assembly takes 40 minutes. Decision deferred. | Fidelity scoring elevates alert based on asset criticality and user privilege level. Reaches analyst queue as priority one within 90 seconds. Investigated and contained in 22 minutes. |
| Insider threat – low and slow data exfiltration over 6 weeks | Individual daily alerts all below severity threshold. Never correlated across the 6-week period. Discovered at audit, 6 weeks after exfiltration began. | Behavioural baseline model detects cumulative deviation at day 9. Pattern correlation across 6 weeks of data surfaces as a single high-confidence alert with full timeline. |
| Supply chain compromise via trusted vendor connection | Traffic from trusted vendor IP generates no alert, vendor is whitelisted. Anomalous lateral movement from vendor session generates 3 low-severity alerts, all auto-closed. | Vendor session behaviour modelled against established baseline. Deviation from normal access pattern new systems, unusual hours, generates contextualised alert with vendor attribution. |
| Critical CVE exploit attempt on unpatched production server | Exploit pattern triggers alert. Alert queued. Server not in asset criticality register, treated as standard priority. Reviewed 18 hours later. Exploitation confirmed. | Alert enriched with asset inventory data, server identified as hosting customer-facing payment application. Immediately escalated. Patched and monitored within 4 hours. |
In every scenario, the high-volume SOC is not failing because it lacks detection capability. It is failing because the detection capability it has cannot be acted on at the volume and without the context in which it is presented. The fidelity-optimised SOC is not detecting more threats, it is making the threats it detects findable.
7. What a Fidelity-Optimised SOC Looks Like
A fidelity-optimised SOC does not have fewer detection tools. It has an architecture layer between those tools and its analysts that ensures every alert reaching a human being already carries the context, correlation, and risk scoring that makes it a decision rather than a data point.
| Dimension | High-volume, low-fidelity SOC | Fidelity-optimised SOC |
|---|---|---|
| Alert volume | 10,000–100,000+ alerts per day: Unfiltered from all tools | 200–2,000 actionable alerts per day: Scored, correlated, and context-enriched |
| Alert investigation rate | 3–8% of alerts receive full investigation | 85–95% of surfaced alerts receive full investigation |
| False positive rate | 40–70%: analysts waste majority of capacity on non-threats | 5–15%: model continuously improves from analyst feedback |
| Mean time to detect | Hours to days: Threat hidden in queue until | Minutes: High-fidelity alerts surface immediately at priority |
| Analyst decision quality | Degraded: Decisions made under volume pressure with incomplete context | High: Decisions made with full context, asset criticality, and behavioural baseline |
| New tool ROI | Negative: Each new tool adds alert volume without improving detection outcomes | Positive: New tool signals are correlated and scored before reaching analysts |
| Analyst retention | Low: Experienced analysts leave within 18–24 months | High: Analysts work on meaningful investigations, not alert processing |
The four architectural components of a fidelity-optimised SOC
- Correlation engine – A layer that receives alert streams from all detection tools and identifies when multiple alerts from different tools represent the same underlying event. A credential compromise that generates alerts in the SIEM, the EDR, and the identity platform arrives at the analyst as one correlated event, not three separate alerts requiring individual triage and manual connection.
- Context enrichment – Every alert is automatically enriched with the data the analyst would otherwise spend 20–40 minutes assembling: asset criticality, user role and privilege level, prior behaviour baseline, active threat intelligence matching, and the asset’s exposure profile from the vulnerability management program. The analyst receives a decision, not an event.
- Risk-based fidelity scoring – Alerts are scored by the intersection of threat severity, asset criticality, and behavioural context, not by the raw severity rating of the tool that generated them. A medium-severity alert on a privileged account accessing a crown-jewel system at 3am ranks higher than a critical-severity alert on a non-production test environment. The scoring model is visible, auditable, and continuously improved by analyst feedback.
- Closed-loop false positive management – Every false positive closed by analyst feedback into the rule tuning process. False positive rates are tracked per rule, per tool, and per analyst team. Rules that consistently generate false positives are tuned or suppressed. The fidelity of the alert environment improves continuously rather than remaining static.
8. Diagnostic Questions for Security Leadership
Before investing in additional detection tools or analyst headcount, security leaders need an honest assessment of whether the current SOC architecture is producing fidelity or volume. These questions are designed to surface the structural gaps that operational dashboards rarely expose.
On volume and fidelity
- What percentage of alerts generated in the last 90 days received full analyst investigation, not auto-close, not batch triage, but a documented investigation with a recorded outcome?
- What is the current false positive rate per tool, and has it improved in the last 12 months or is it static because false positives are not being fed back into rule tuning?
- If alert volume doubled tomorrow, what would break first and does the answer tell you something about whether the current architecture is managing volume or managing fidelity?
On detection outcomes
- What is the mean time to detect for incidents that were eventually contained and how does that compare against the time the initial alert was generated?
- In the last 12 months, how many significant incidents had a corresponding alert that was generated but not investigated in time and what was the dwell time consequence?
- Does your SOC have a documented signal-to-noise ratio that is tracked and reported to security leadership or is alert volume the only metric being managed?
On architecture and investment
- Do your detection tools output directly to an analyst queue, or is there a correlation and fidelity-scoring layer between tool output and analyst triage?
- When a new security tool is added to the SOC, does alert volume increase and if so, what is the process for ensuring that increase improves detection outcomes rather than compounding fatigue?
- Is the investment allocation in your SOC weighted toward detection coverage or detection fidelity and does that weighting reflect where the operational constraint actually sits?
If these questions reveal that alert volume is the primary metric being managed and detection fidelity is not being measured, the SOC is optimised for activity reporting rather than security outcomes. The architectural gap between those two operating states is where the investment case for fidelity remediation sits.
9. The Path From Volume to Fidelity
The transition from a high-volume, low-fidelity SOC to a fidelity-optimised one does not require replacing detection tools, rebuilding the SIEM, or hiring a larger team. It requires building the architectural layer that was missing between the tools and the analysts, the correlation, enrichment, and scoring infrastructure that converts alert volume into actionable signal.
Phase 1: Correlation and deduplication: four to six weeks
Implement cross-tool alert correlation to identify when multiple tools are firing on the same underlying event. In most enterprise environments, 30–50% of daily alert volume is duplicate coverage of the same events from different tools. Eliminating that duplication alone reduces analyst load materially without touching detection coverage.
Phase 2: Context enrichment: six to ten weeks
Connect the alert pipeline to asset inventory, user directory, vulnerability management data, and threat intelligence feeds. Configure automatic enrichment so that every alert reaching an analyst already contains asset criticality, user role, and the context that would otherwise require 20–40 minutes of manual assembly. This single change has the highest per-hour ROI of any SOC architectural investment.
Phase 3: Fidelity scoring and prioritisation: eight to twelve weeks
Implement risk-based fidelity scoring that combines threat severity, asset criticality, and behavioural context into a single priority score for each alert. Build the feedback mechanism that routes analyst false positive decisions back into rule tuning. Configure the scoring model so it is visible and auditable, analysts who understand why an alert is prioritised make better decisions than analysts who process a queue with no priority logic.
Phase 4: Continuous improvement: ongoing
Track fidelity metrics, false positive rate by tool and rule, investigation rate, mean time to detect and report them alongside volume metrics. Make rule tuning a standing operational process rather than a periodic project. Build the closed loop between detection outcomes and rule quality that ensures the fidelity of the SOC environment improves continuously rather than decaying back to high-volume noise as the threat landscape evolves.
The organisations that have made this architectural transition consistently report the same outcome: fewer alerts, better detections, lower analyst attrition, and a SOC that is genuinely capable of finding threats rather than processing them. The alert volume was never the asset. The signal inside it was, and building the architecture that surfaces it is the investment that every other SOC capability depends on.
Working with Prudent
The future of security operations will not be defined by how many alerts a SOC can generate, but by how effectively it can surface the few that truly matter. Enterprise security teams are not suffering from a visibility problem; they are suffering from a fidelity problem. The organisations that solve it will detect faster, respond earlier, and operate with clarity instead of chaos.
Organisations gain more than additional visibility; they gain the operational clarity required to make security decisions at speed. We help enterprise SOCs reduce alert noise, improve analyst effectiveness, and build architectures designed around detection fidelity rather than alert volume. By integrating correlation, enrichment, and risk-based prioritisation into the detection pipeline, security teams can focus on the threats that carry real business impact.
The result is a SOC that scales intelligently, responds faster, and delivers measurable security outcomes instead of overwhelming operational noise. The path forward is not more dashboards, more tools, or more noise. It is architecture that transforms raw detection data into actionable intelligence.
A SOC overwhelmed by alerts is not seeing more threats, it is losing the ability to recognise the real ones.
For organisations looking to reduce alert fatigue and improve SOC detection fidelity, our detailed breakdown explores the architectural changes required to transform alert volume into actionable security outcomes.